Experimental and numerical investigation of cavitation phenomenon in the flapper-nozzle pilot stage of an electrohydraulic servo valve

Department of Fluid Control and Automation Harbin Institute of Technology, Harbin, China Contact: lisongjing@hit.edu.cn
Background

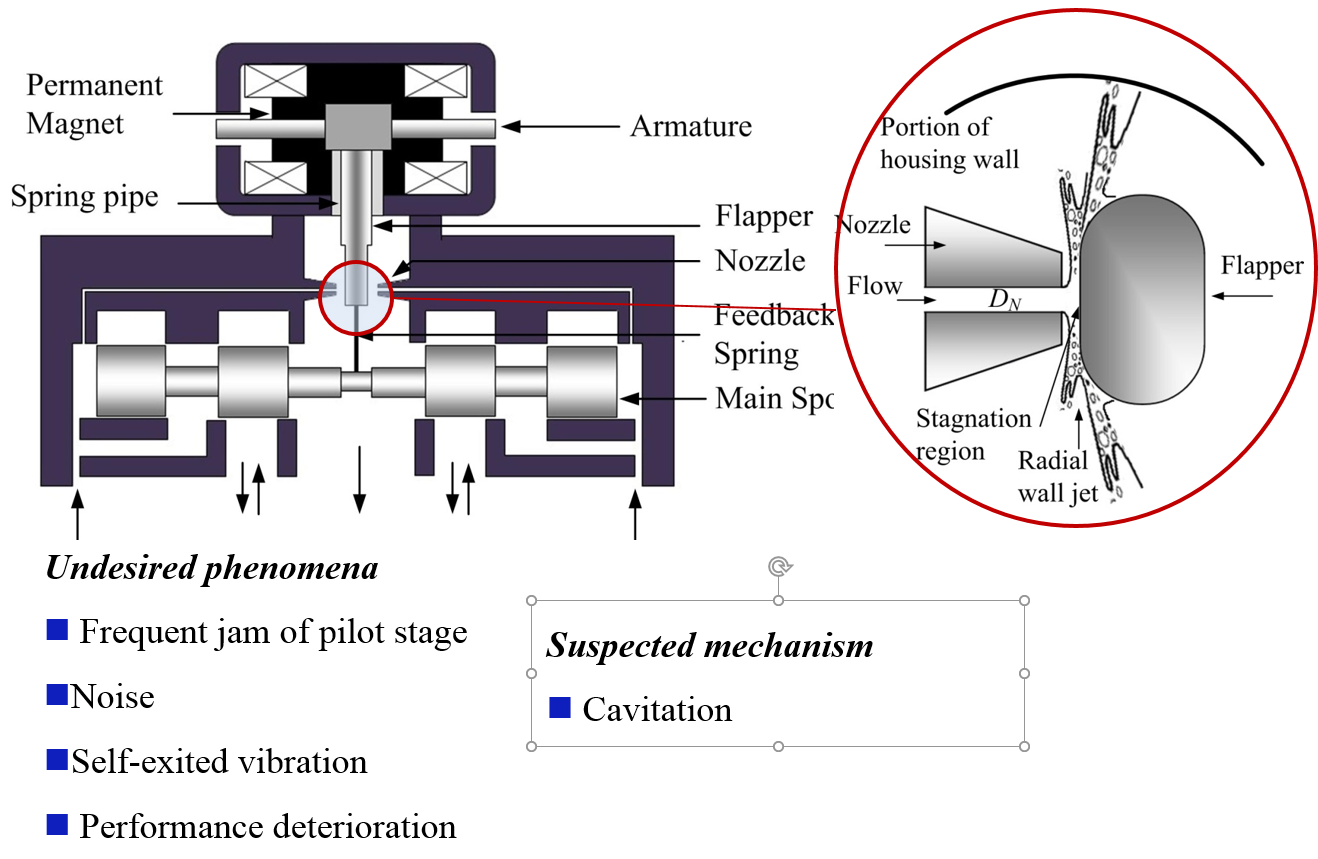
Fig. 1 - Electrohydraulic servo valve.
Experimental investigation
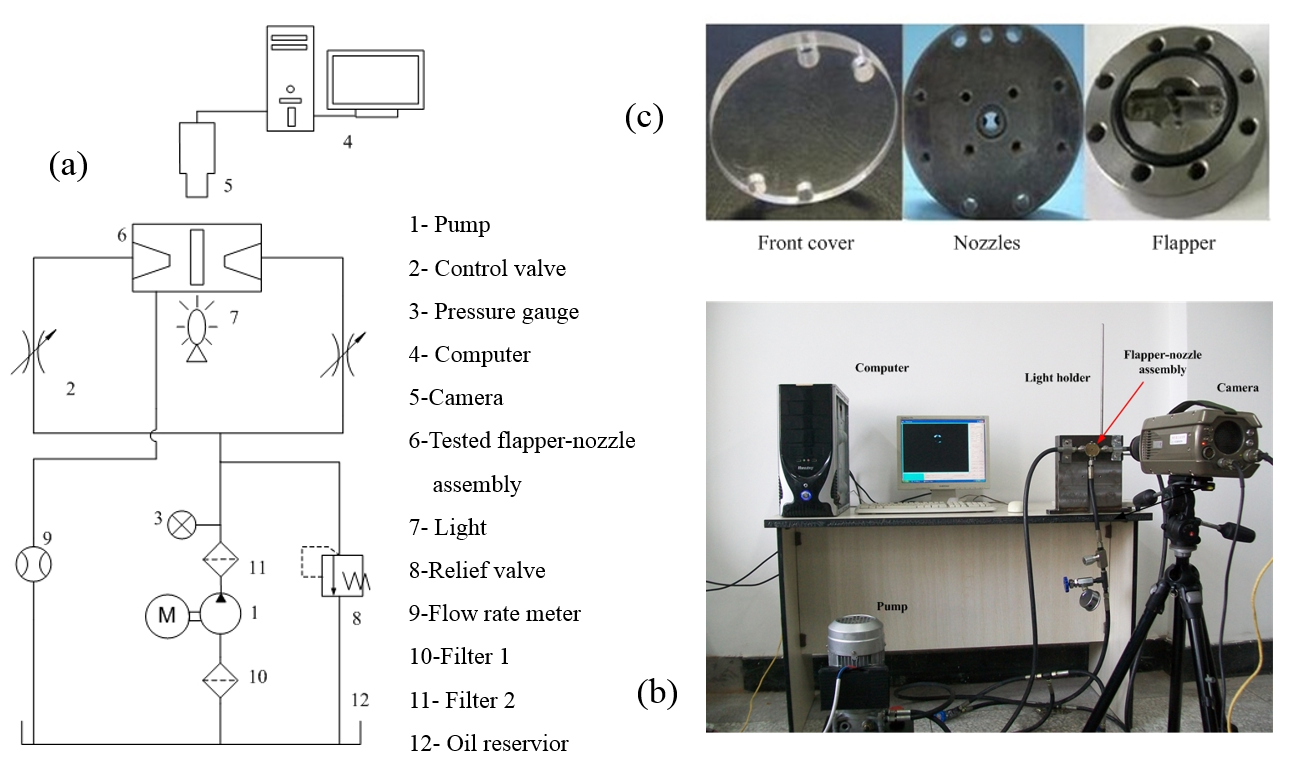
To give the understanding of flow field distribution and cavitation phenomenon in the pilot stage of an electrohydraulic servo-valve, an assembly that represents flapper-nozzle pilot stage is produced. It contains a flapper, a nozzle, a house, a front cover and a back cover, as shown in Fig. 2.
To visualize the observed flow phenomenon, a high-speed video camera (PHANTOM-2009B) is used. It is placed 0.5 m in front of the test section and connected to a computer so that the recorded images can be directly displayed.
The circulating hydraulic fluid is MIL-H-5606 provided from CAESTRO. It is supplied to the test section by a hydraulic power source with a pump and other necessary components. In experiments, several flow conditions are created by varying inlet pressure and correspondingly, the inlet velocity of the nozzle in the range of 12.6~50 m/s.

Fig. 2 - Experimental system.
Numerical investigation
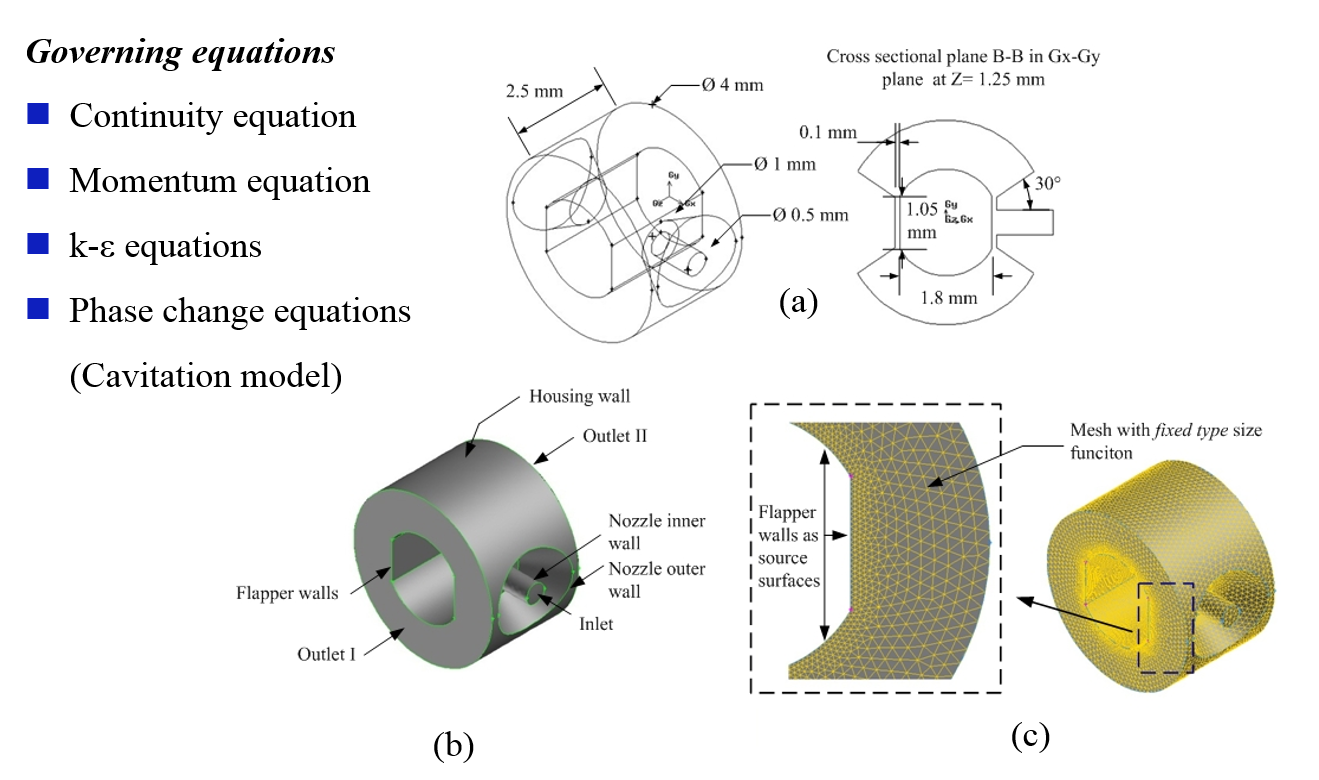
To compute the cavitation phenomena at different inlet velocity, the set of following equations are solved in simulations. Flow equations for a two-phase mixture are obtained from the ensemble averaging of the Navier–Stokes equations. The equations for mixture turbulent kinetic energy and its dissipation rate are obtained by the summation of the mixture as a single phase. The detailed geometry and meshed model of flapper-nozzle are shown in Fig.3 (a)-(c). The flapper has flattened surfaces facing to nozzle orifices. The model is discretized by using a systematic mesh to achieve clear information around the flapper and nozzle and reduce computing time.

Fig. 3 - Numerical models.
Observations

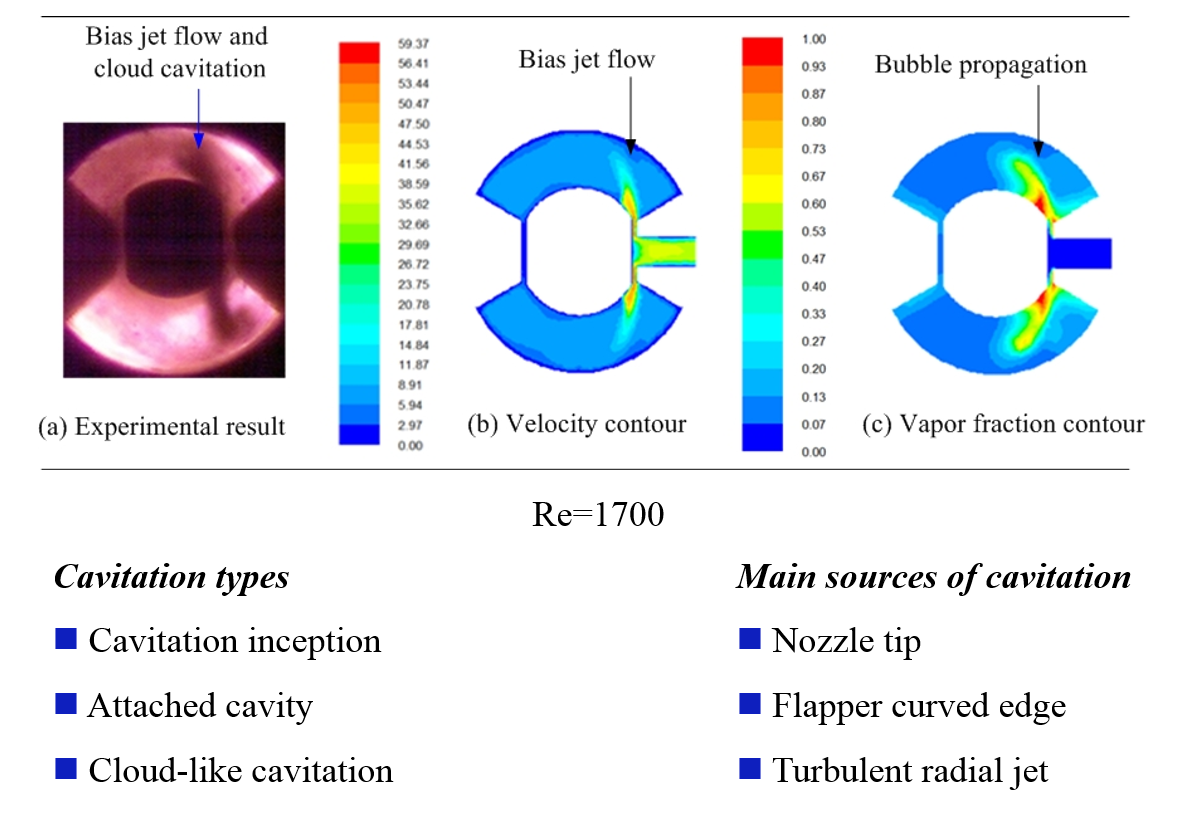
Fig. 4
Conclusions
- Cavitation in the pilot stage is confirmed as one significant mechanism for noise, vibration and performance deterioration of electrohydraulic servo valves
- Nozzle tip, flapper curved surface, and turbulent radial jet are main sources of cavitation in the pilot stage
- Attached cavity is formed at the separated flow region on the curved surface of the flapper
- The cloud-like cavitation occurs along the radial jet at higher Reynolds numbers
- Log in to post comments
